
Hello guys!! Today i’m writing down a couple of notes about a project I did started 1 month ago together with @rEDSAMK, Unicorn DOPE Debugger (GitHub).
First off, I’m gonna spend a couple of line about the purpose and the goal, mainly, why it has been created. As I said in the last 5 minutes of my keynote at Disobey, with this tool, my goal is to provide a runtime environment for the awesome Unicorn emulator very similar to GDB, in terms of commands and features but, thanks to the fact that we are just speaking about debugging and “replicating” a static context (for instance, we are “emulating” something) we can take advantage to this to extend and add more functionalities.
The tool is born mainly to face any further Supercell games update, since I used emulation to debug and reverse engineer complex functions even through kilobytes of dead instructions for obfuscate the real behavior. It allows to set breakpoints and step through instructions, explore registers and memory regions with an elegant output.
Actually, since all my challenges and goals goes around ARM/ARM64, I’m focussing on extending features which aims to reach MY PERSONAL goals, indeed, we are focussing on building things as abstract as possible, dreaming to have more people involved which will use it for different purposes on different architectures.
Buuuut… Since the tool was built after what’s actually built for (I don’t know if this makes much sense in english, what I want to say is that it hasn’t been tested on a real usage case, till now), I didn’t had any chance to “solve the last things to get it ready for “”production””. During the last week I had to reverse engineer another complex function, a custom buffer compression, and so, why not taking this chance to try uDdbg?
Side note: the name came from a derp while creating the repository… I did added by misstake a “D” more which turns out to be “DOPE”.
So, before going into the usage case, let me say that I’m really impressed about the potential, it turn out to be very very usefull, easy to use and it probably saved me a lot of time, but this is different for everyone so let’s move on…
I won’t say any details about the target, let’s keep it abstract. We want to port a function inside an android native library to py, or, we just want to inspect it’s behavior, or, whatever?
What’s next:
- Check if our function takes arguments, if so, check if those arguments are pointers or just values. If they are just values, we can jump to 3.
- Set an hook to the entry point of the function and check the arguments by exploring memory. This is do-able with 3 lines of JS and Frida (I’m not going to post here how since it’s not the topic) and if you are lazy like me, you can just dump whatever memory region is pointed on registers and straight load everything into uDdbg
- Load the binary into uDdbg, eventually load dumps if you did step 2, create your executor (explained later) and debug with a cup of coffee
Why this is better (imho):
- My target are mostly games, which just have different and crazy way to prevent people from debugging. It’s cool, you can spend days to find out the anti-debugger and kill it.. or you can save time
- It’s replicable. Imagine you are dealing with a simple crypto which xor using a timestamp. Each run a different result.
- You can load the same context hundred of times in a millisecond and step instructions like you are using GDB
- It’s built to reverse engineer so, expect to find inside things that are useful for reverse engineering
The tool is very easy to use, you can type help inside the cli to retrieve the list of commands.
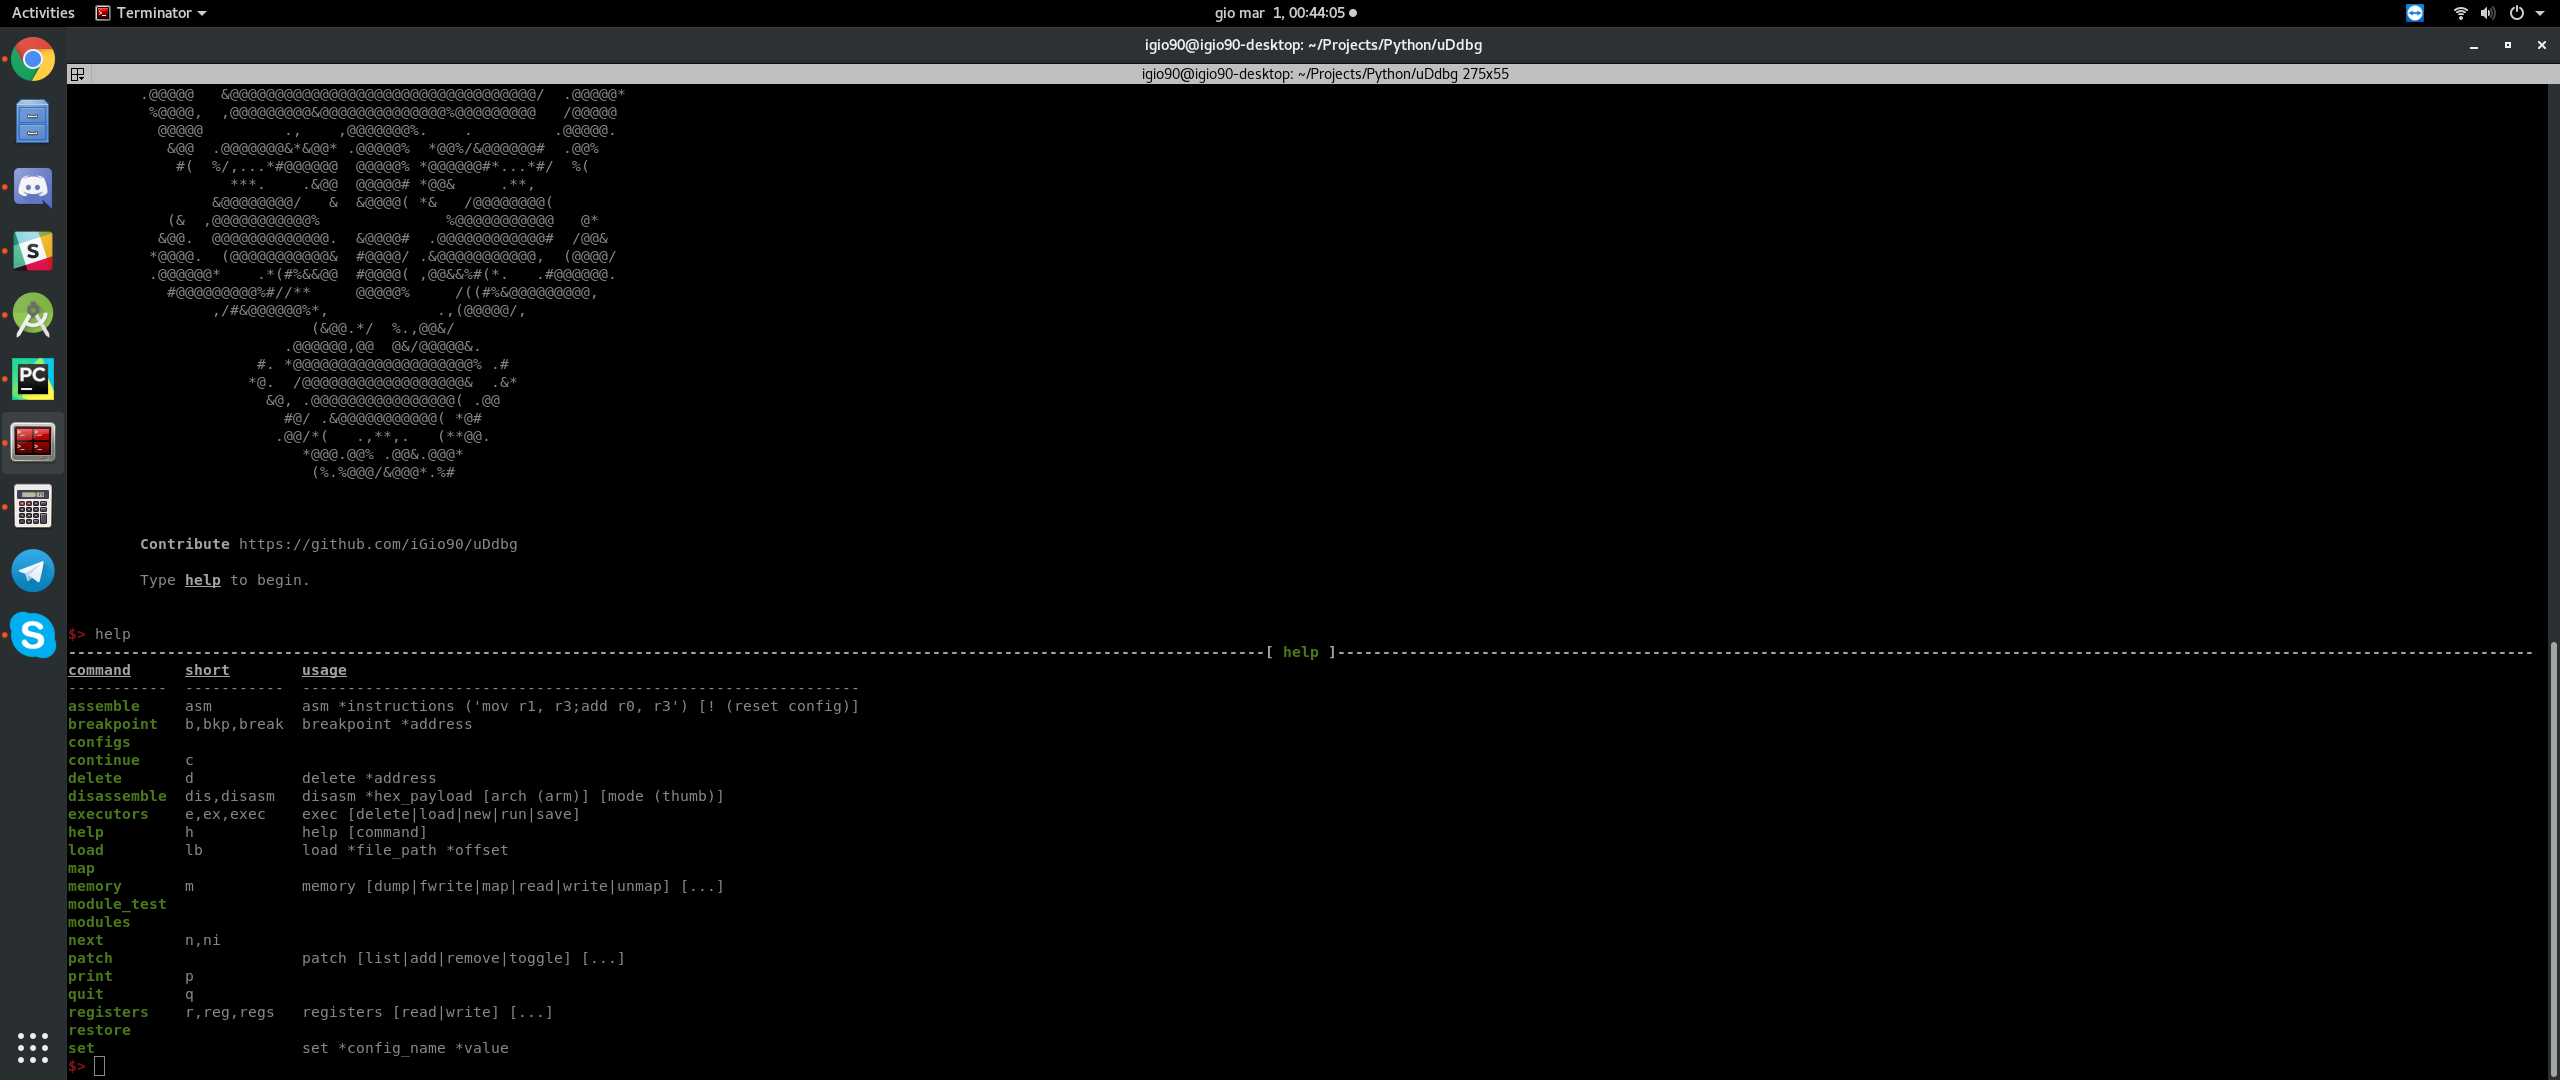
Taking in example an available command:
memory read 0x10000 128
the same result can be achieved with:
m r 0x10000 64+64
or:
mem r 0x5000*2 +64*2
Another awesome thing that saved me a lot (A LOT) of time, are executors – here is a short description from the wiki of the project:
If you are familiar with GDB, the executors are something very similar to commands for the GNU debugger. They basically allows you to avoid cyclic and redundant tasks. Here is a very quick example of an executor to give you a better idea:
$> ex new
executor name: sample_executor
creating executor 0. add 1 command per line. type "end" to save
memory map 0x10000 128
registers write r0 0xFF
r w r2 0xD34DB33F
load target_library.so 0x50000
patch add 0x51000 00BF00BF
end
$> ex
----------------------------------------------[ help ]----------------------------------------------
usage: exec [delete|load|new|run|save]
--------------------------------------------[ executors ]--------------------------------------------
  id  name               commands
----  ---------------  ----------
   0  sample_executor           5
$> ex save 0
saved 5 commands into executors/sample_executor
$> ex load sample_executor
mapped 1024 at 0x10000
0xff written into R0
0xd34db33f written into R2
....
Executors are saved and read later as normal text files, so, they can be manually modified with easy in case of errors.
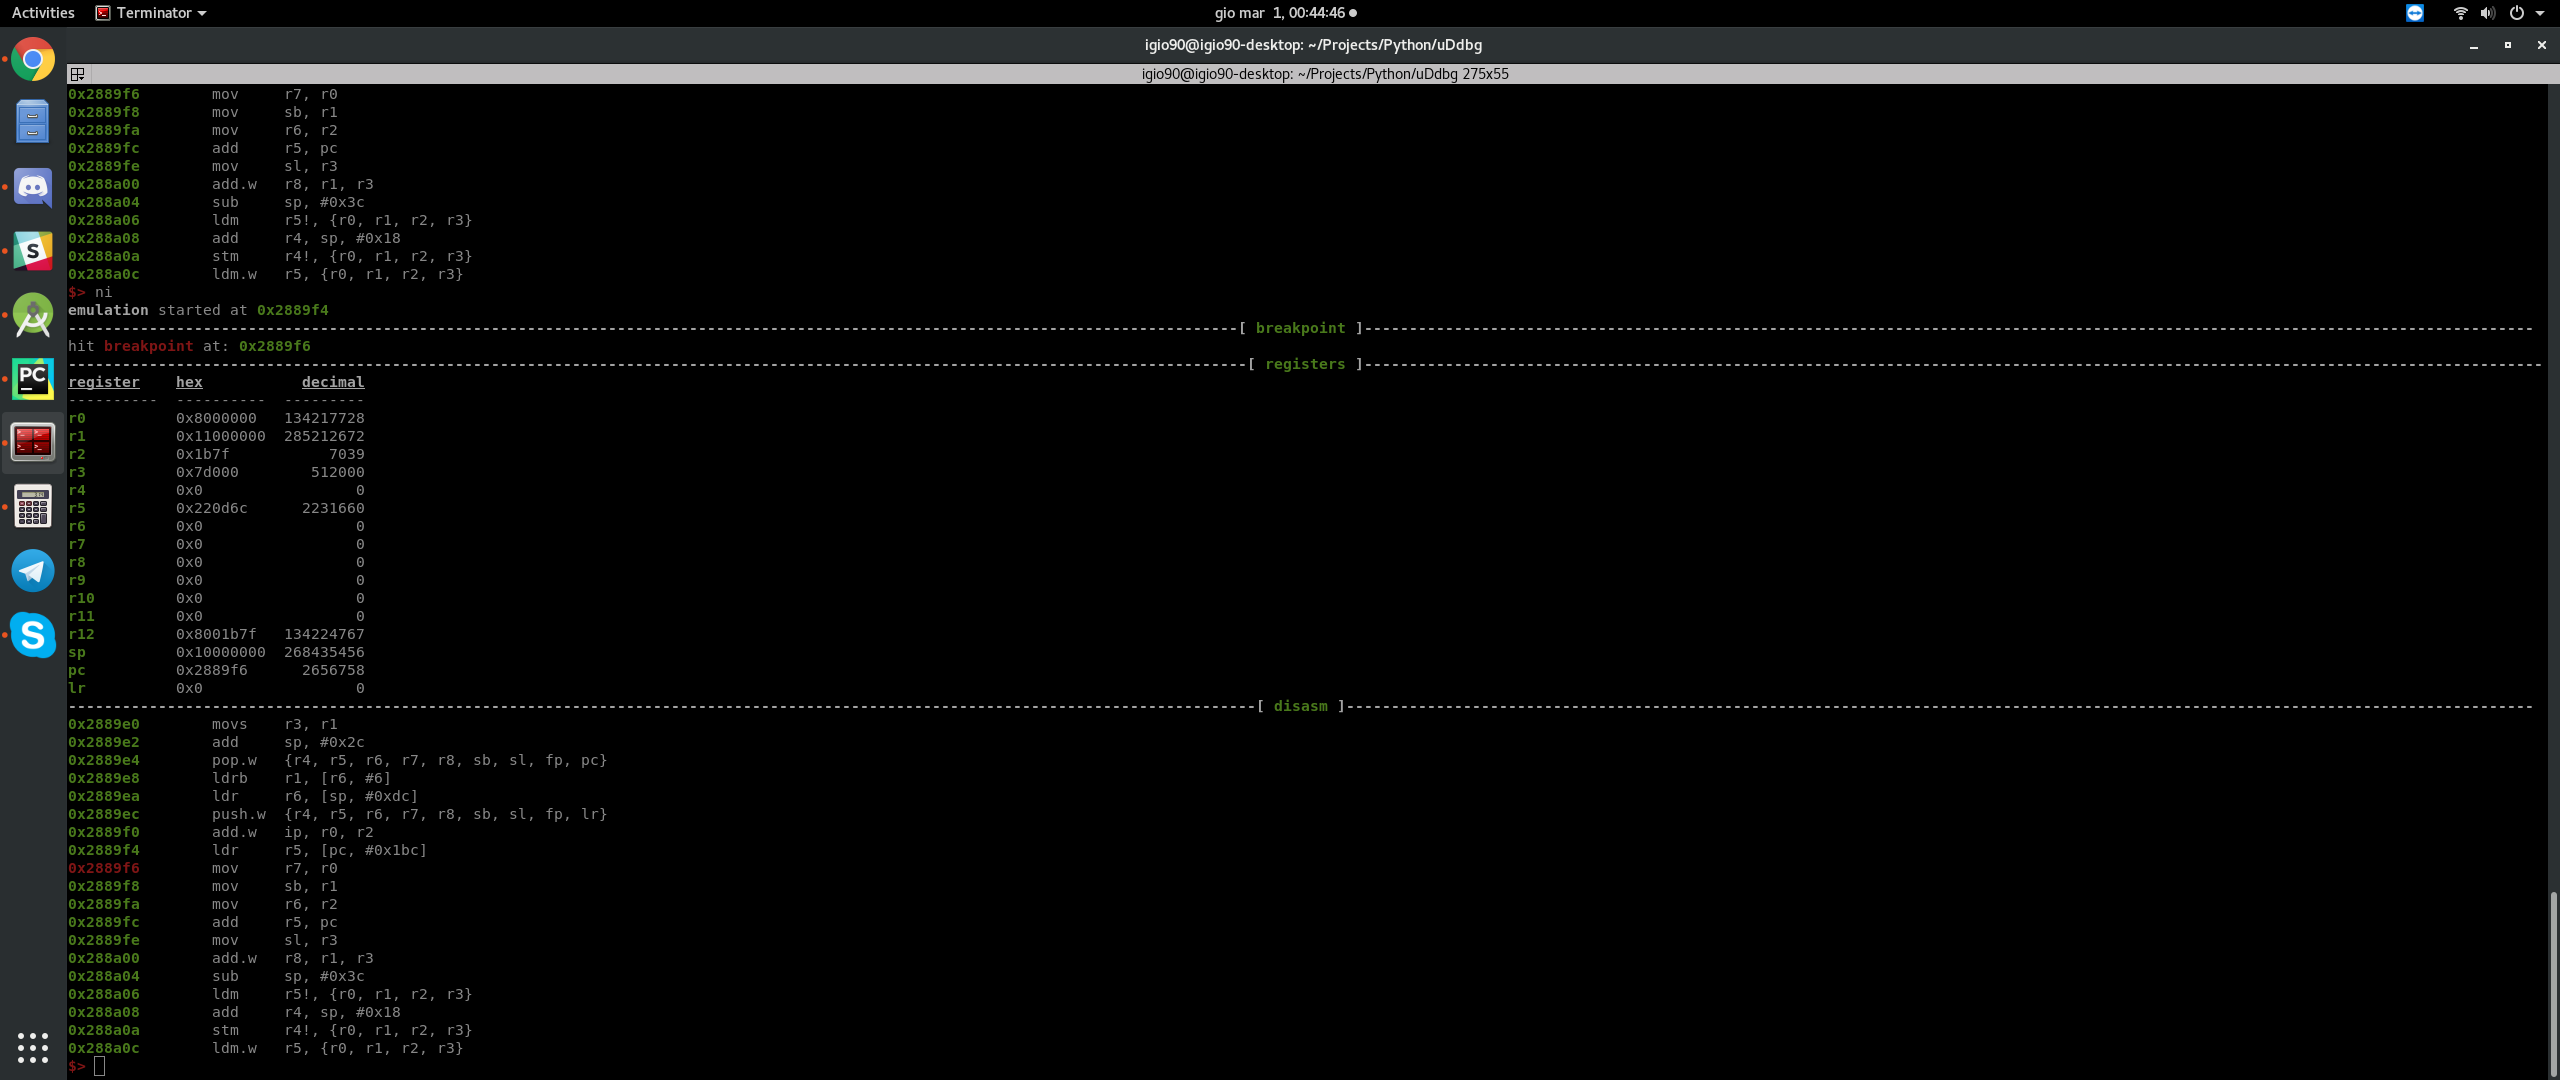
Here are the 4 commands that took me ready to debug once I had the executor ready:
- python main.py
- select CPU / MODE
- e l 1 (short version of ‘executor load 1’ – 1 is the name of the executor file name)
- ni, ni, ni, ni, ni, ni, ni (short of ‘next instruction’)

…and here is the executor (for instance, the content of ‘1’) with explaination:
// An executor doesn't allow comments, this is just for showcase
// Note: all of this will setup 'the initial context'
// That context, can be restored during runtime to restart the session

// load lib.so at address 0x10000 (load map necessary space)
load lib.so 0x10000
// load stackpointer dump
load spdump 0x10000000-1024
// m (short of 'memory') map 48000 at address 0x8000000
m map 0x8000000 48000
// map 0x7d000 at address 0x11000000
m map 0x11000000 0x7d000
// memory write bytes.fromHex(DEAD0000FFFFFFFF) at 0x8000000
m w 0x8000000 DEAD0000FFFFFFFF
// set the entry and exit point of target function
// for instance, start and stop of emulation
set entry_point 0x10000+0x002789f0
set exit_point 0x10000+0x00278bae
// write registers
r w r0 0x8000000
r w r1 0x11000000
r w r2 0x1b7f
r w r3 0x7d000
r w r4 0x0
r w r5 0x0
r w r6 0x0
r w r7 0x0
r w r8 0x0
r w r9 0x0
r w r10 0x0
r w r11 0x0
r w r12 0x0
r w lr 0x0
r w sp 0x10000000
The project is available on Github, the wiki is still in progress… maybe someone will help me build it… (one day…)
Happy debugging!