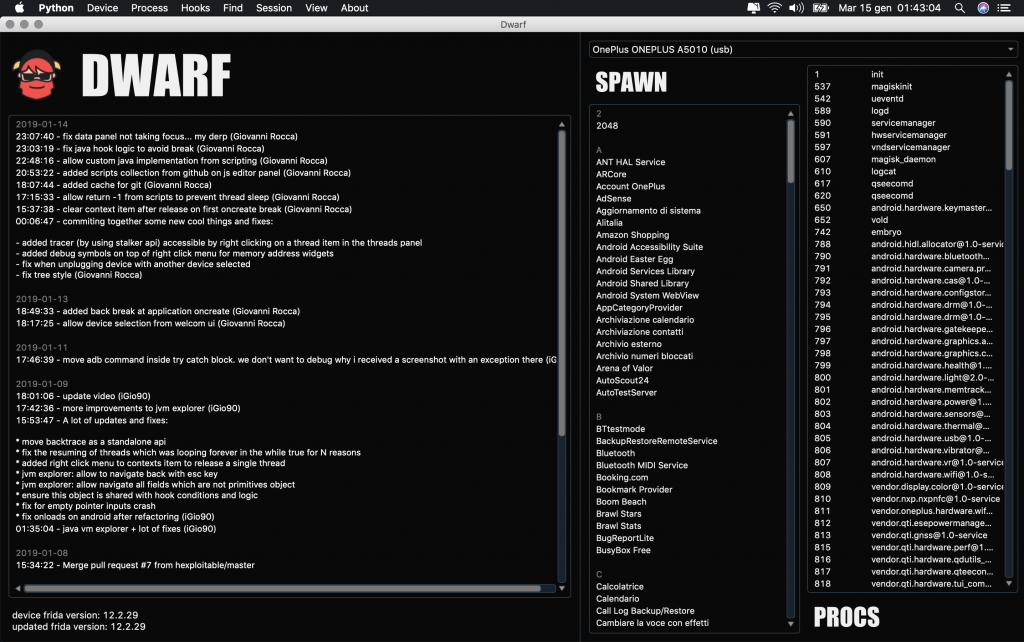
Hello folks and welcome to a small introduction of my new debugger, dwarf.
Background and development purpose
After about 2 years of researches on mobile cracking and various challenges won, I’ve packed together my experiences with some of the linux eco-system knowledge I collected together with my 8 years of android and backend development. The result is a framework, which I like to call a debugger but it allows you to play with various things which are related to cracking but not to debugging (i.e, dumping applications binary from the device and so on).
People following my works on github may know that 1 years ago I came out with a CLI debugger, frick, which is a pure debugger, but with all the limitation of a CLI tool. Dwarf already hit 3 times the lines of code of frick and include way more things and features such as jvm explorer for Android and much more.
The purpose of Dwarf is to simplify tasks while doing reverse engineering, cracking and security analysis on a process running on a mobile phone running either Android or iOS.
Built on top of various technologies
The 2 challenges for me was to learn PyQt and being able to create something with a decent UI that can run on linux, windows and OSX and making the debugging side as abstract as possible to allow sessions on both Android and iOS.
Dwarf GUI is built on top of the following framework and tools:
- PyQt5
- Frida (Process instrumentation)
- Capstone engine (Disassembler)
- Keystone engine (Assembler)
- Unicorn engine (CPU emulation)
Install, Update, Run
Installing Dwarf is very easy. Everything you need to do is clone the repository and start the python file as explained in the README on the github repo. Updating is managed in app and happens using git.
Features
In the moment I’m writing this post, Dwarf already allows you to a lot of things, I used “already” because it’s up since around 1 month.
- Breakpoint native layer on Android and iOS
- Breakpoint java functions and constructors on Android
- Breakpoint module load by leaking base on Android (allows early module initialization debugging)
- Memory watchers for read/write access
- Expose public js api for runtime/static scripting
- Allow exploring java classes and object instantiated in runtime when hitting a breakpoint in the java layer
- Enumeration of ranges, modules, java classes and methods
- Allow to spawn or inject a process and allow to use custom js panel (see later)
- Console evaluating js inline or though js panel (see next)
- JS panel allowing javascript code as evaluated function with shortcuts to load plugins from a “plugin repository on github” or from a file
- Allow to set condition and logic to each breakpoint if added from UI, otherwise breakpoints could be added also from console with custom callbacks
- Expose public js api to interact with the UI – send data from js script side to the ui
- Allow to switch between threads with ease (i.e, more then 1 thread hit breakpoint at memcpy and another one hit a java breakpoint)
- Backtrace on both native and java layer
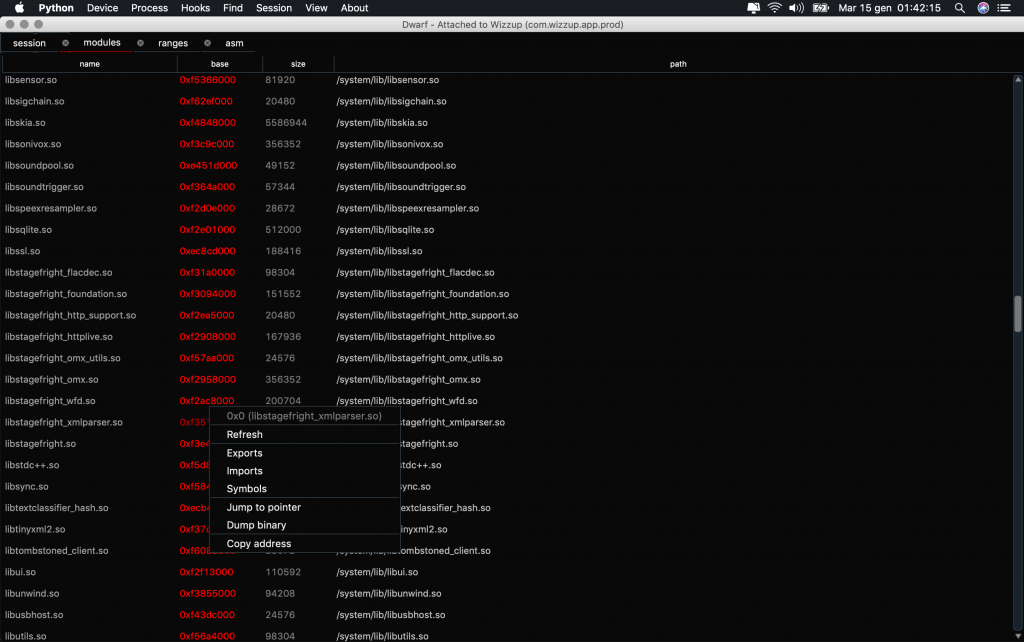
- Any pointer displayed in UI have a context (right click) menu that allows to quickly access to symbols, jump to hex view, disasm, dump memory and so on
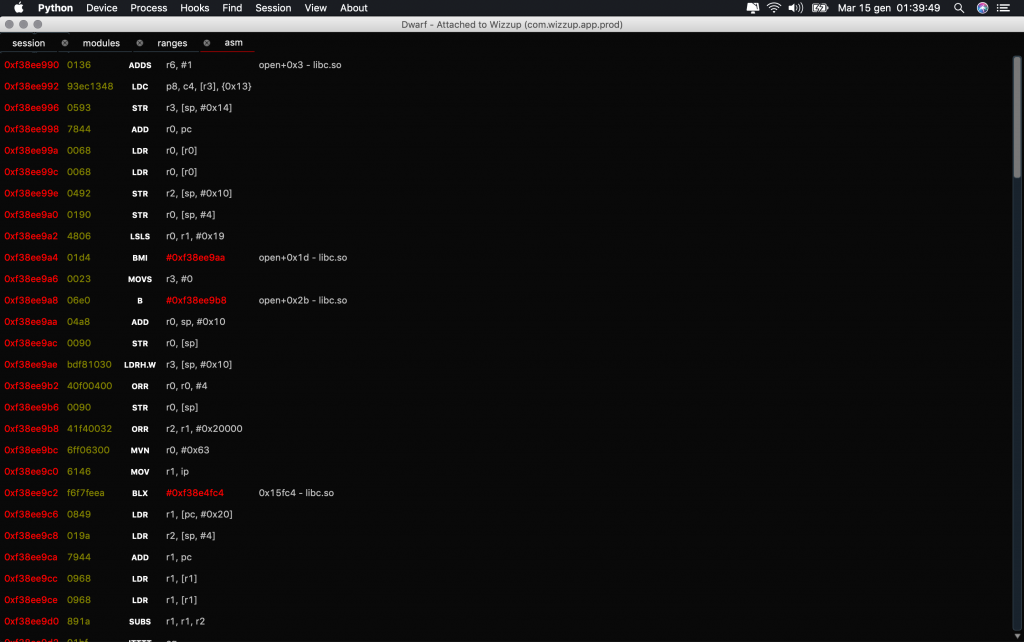
- Hex view and ASM view to lazy populate the whole range of the selected pointer
- Patch instructions, write bytes and string with ease
- Export and import back breakpoints
- Restart and reload the target binary
- From within the app, on Android only, you can update frida server and dump binaries (apk)
- it’s opensource
Breakpoints
The breakpoint logic is a bit different from Frick one. My first debugger, once a breakpoint is hit, take care of breaking all threads by using a combination of setting signal handlers + using tkill syscall and frida bridge api to sleep the current code execution thread. Dwarf instead will only use the frida bridge as the UI allows a comfortable way to switch between contexts and have code execution inside each thread (to be allowed to change a register in each thread i.e). Was really nice to see that also r2frida is using the same approach with success, it just confirm I took the right way.
Memory watchers (watchpoints)
By using a combination of VM page protections and exception handling, Dwarf allows to set memory watchers for detect and break whenever an instruction attempt to read or write our target memory address.
There are several advantages and some disadvantages, but what’s more “killer” is that they are totally stealth, as they doesn’t alter the memory layout and way way less expensive then hardware watchpoints.
Start debugging with dwarf
Once you are inside the home UI, getting started is very easy. You can take a look at the video, which is not on top of the new version but will show quickly how to start, or you can simply spawn a process and start play with the various menu and buttons.
In Android, once the process is spawned and if our target is a standard Android application, a first breakpoint will be applied to Application.onCreate to allows initial debugging setup. An efficient solution for iOS still need to be found in the moment I’m writing this.
To resume the target when a breakpoint is hit, you can use the menu device-> resume or the shortcut “ctrl+T”.
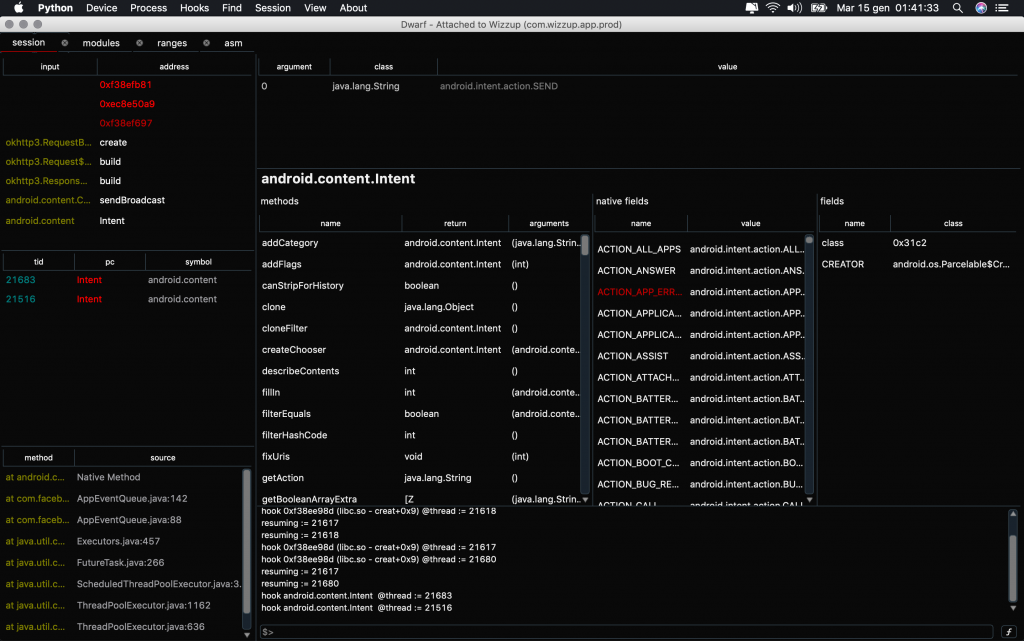
JVM Runtime explorer
For whose is familiar with Android programming, for sure knows the advantages of debugging own android apps by using the Android Studio debugger. I’ve inspired my Android runtime debugger to Android Studio one, by allowing recursion and exploration of java fields and methods. The enumeration was pretty tricky as frida doesn’t expose (yet) api to do so.
Example script available in js editor
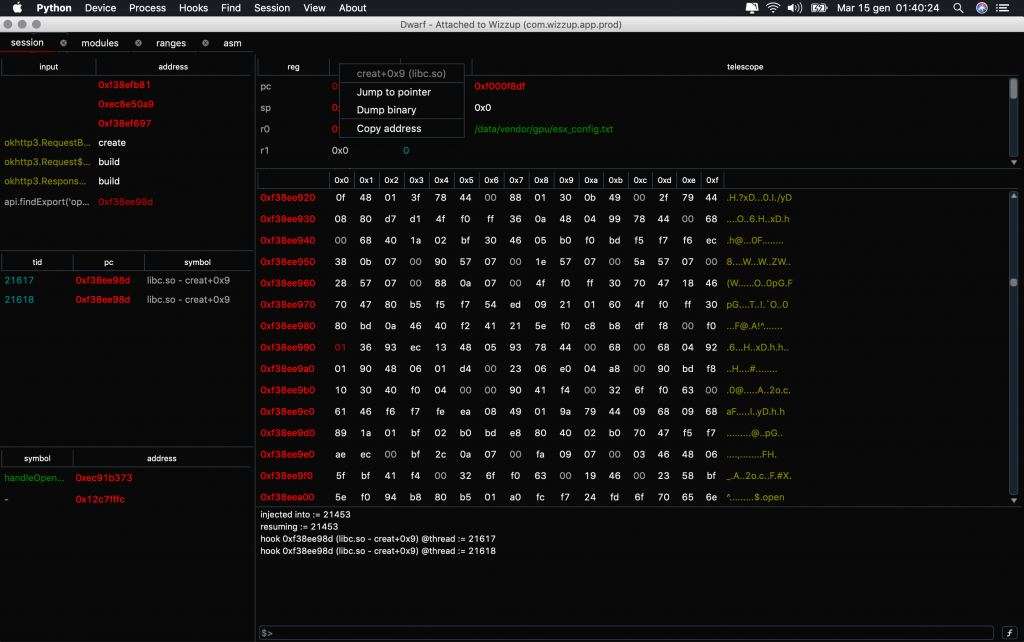
Dwarf js editor have a little shortcuts which will list scripts ready to be used added by me or by the community. The first script i’ve created which could be loaded in less then 3 seconds on a process, is something to dump and display network requests (headers and body) by hooking low level syscalls and okHttp3 for Android. This allows to read network i/o without the needed to unpin certificates.
The script is accessible here.
Saving time
The core key is always saving time and avoid redundant tasks. This is one of the main reason I left Frick development, because in the end, I was always needed to code the scripts to inject. Dwarf is also built on top of this idea, being as abstract as possible and depend as much as possible from the script. Simplify the scripting phase by providing non-complex api and display data with a pretty decent UI (we are still speaking about my first PyQt based application and many side of UI are still far from a “wow” but it’s acceptable).
The power of the community
As I did many time, I’m going to finish this post by highlighting the power of the community and the opensource. Some of the fixes i did on Dwarf comes from discussions on our Slack crew server or by pull requests and I believe that many new cool things will be added in the near future to keep up “action, reaction – cause, effect – mitigation, solution”.